|
Download Data (XLS File) |
|
|||||
|
|||||
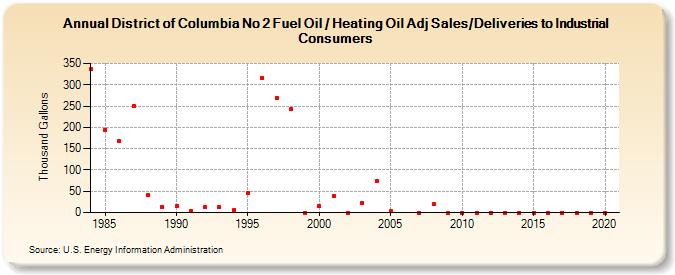
| District of Columbia No 2 Fuel Oil / Heating Oil Adj Sales/Deliveries to Industrial Consumers (Thousand Gallons) | |||||
| Decade | Year-0 | Year-1 | Year-2 | Year-3 | Year-4 | Year-5 | Year-6 | Year-7 | Year-8 | Year-9 |
|---|---|---|---|---|---|---|---|---|---|---|
| 1980's | 337 | 195 | 167 | 251 | 41 | 14 | ||||
| 1990's | 15 | 4 | 12 | 13 | 5 | 45 | 316 | 269 | 242 | 0 |
| 2000's | 15 | 40 | 0 | 23 | 74 | 3 | -- | 0 | 19 | 0 |
| 2010's | 0 | 0 | 0 | 0 | 0 | 0 | 0 | 0 | 0 | 0 |
| 2020's | 0 |
| - = No Data Reported; -- = Not Applicable; NA = Not Available; W = Withheld to avoid disclosure of individual company data. |
| Release Date: 2/9/2022 |
| Next Release Date: Suspended |