|
Download Data (XLS File) |
|
|||||
|
|||||
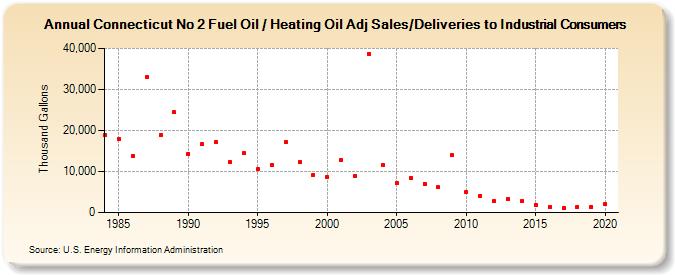
| Connecticut No 2 Fuel Oil / Heating Oil Adj Sales/Deliveries to Industrial Consumers (Thousand Gallons) | |||||
| Decade | Year-0 | Year-1 | Year-2 | Year-3 | Year-4 | Year-5 | Year-6 | Year-7 | Year-8 | Year-9 |
|---|---|---|---|---|---|---|---|---|---|---|
| 1980's | 18,862 | 17,889 | 13,788 | 33,018 | 18,875 | 24,391 | ||||
| 1990's | 14,347 | 16,605 | 17,078 | 12,285 | 14,393 | 10,502 | 11,603 | 17,141 | 12,253 | 9,179 |
| 2000's | 8,660 | 12,887 | 8,916 | 38,717 | 11,579 | 7,109 | 8,382 | 7,036 | 6,156 | 13,932 |
| 2010's | 4,962 | 4,049 | 2,720 | 3,348 | 2,813 | 1,923 | 1,427 | 1,139 | 1,468 | 1,431 |
| 2020's | 2,072 |
| - = No Data Reported; -- = Not Applicable; NA = Not Available; W = Withheld to avoid disclosure of individual company data. |
| Release Date: 2/9/2022 |
| Next Release Date: Suspended |