|
Download Data (XLS File) |
|
|||||
|
|||||
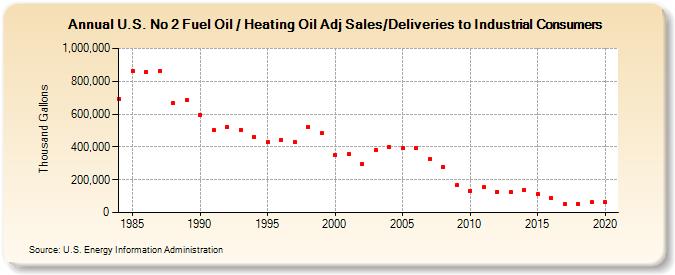
| U.S. No 2 Fuel Oil / Heating Oil Adj Sales/Deliveries to Industrial Consumers (Thousand Gallons) | |||||
| Decade | Year-0 | Year-1 | Year-2 | Year-3 | Year-4 | Year-5 | Year-6 | Year-7 | Year-8 | Year-9 |
|---|---|---|---|---|---|---|---|---|---|---|
| 1980's | 688,837 | 863,460 | 858,458 | 859,836 | 664,967 | 687,636 | ||||
| 1990's | 596,186 | 502,180 | 522,450 | 502,973 | 462,283 | 428,870 | 442,883 | 430,776 | 522,856 | 482,081 |
| 2000's | 352,104 | 354,479 | 296,477 | 381,934 | 398,786 | 393,257 | 393,760 | 326,558 | 278,361 | 166,138 |
| 2010's | 133,051 | 153,182 | 126,976 | 123,845 | 136,058 | 111,563 | 90,465 | 50,445 | 54,388 | 61,395 |
| 2020's | 61,814 |
| - = No Data Reported; -- = Not Applicable; NA = Not Available; W = Withheld to avoid disclosure of individual company data. |
| Release Date: 2/9/2022 |
| Next Release Date: Suspended |