|
Download Data (XLS File) |
|
|||||
|
|||||
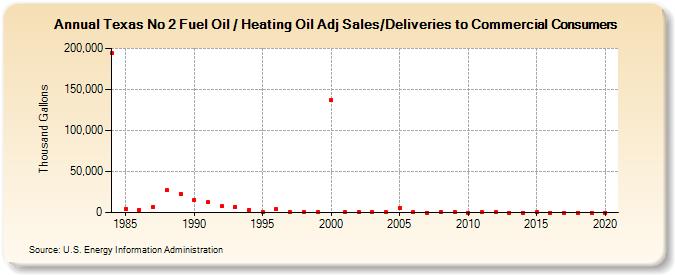
| Texas No 2 Fuel Oil / Heating Oil Adj Sales/Deliveries to Commercial Consumers (Thousand Gallons) | |||||
| Decade | Year-0 | Year-1 | Year-2 | Year-3 | Year-4 | Year-5 | Year-6 | Year-7 | Year-8 | Year-9 |
|---|---|---|---|---|---|---|---|---|---|---|
| 1980's | 193,975 | 4,385 | 3,637 | 7,287 | 26,912 | 23,152 | ||||
| 1990's | 15,766 | 12,417 | 7,465 | 7,363 | 3,068 | 1,000 | 4,022 | 621 | 1,040 | 623 |
| 2000's | 136,977 | 247 | 491 | 383 | 151 | 5,281 | 86 | 57 | 702 | 839 |
| 2010's | 0 | 239 | 202 | 0 | 0 | 294 | 0 | 0 | 0 | 0 |
| 2020's | 2 |
| - = No Data Reported; -- = Not Applicable; NA = Not Available; W = Withheld to avoid disclosure of individual company data. |
| Release Date: 2/9/2022 |
| Next Release Date: Suspended |