|
Download Data (XLS File) |
|
|||||
|
|||||
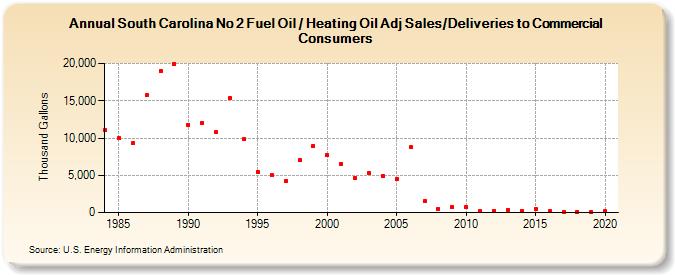
| South Carolina No 2 Fuel Oil / Heating Oil Adj Sales/Deliveries to Commercial Consumers (Thousand Gallons) | |||||
| Decade | Year-0 | Year-1 | Year-2 | Year-3 | Year-4 | Year-5 | Year-6 | Year-7 | Year-8 | Year-9 |
|---|---|---|---|---|---|---|---|---|---|---|
| 1980's | 11,049 | 9,975 | 9,290 | 15,720 | 19,003 | 19,943 | ||||
| 1990's | 11,782 | 12,055 | 10,765 | 15,309 | 9,811 | 5,453 | 5,038 | 4,209 | 6,989 | 8,911 |
| 2000's | 7,683 | 6,572 | 4,686 | 5,317 | 4,901 | 4,526 | 8,736 | 1,526 | 483 | 712 |
| 2010's | 691 | 168 | 268 | 383 | 250 | 457 | 159 | 116 | 120 | 140 |
| 2020's | 175 |
| - = No Data Reported; -- = Not Applicable; NA = Not Available; W = Withheld to avoid disclosure of individual company data. |
| Release Date: 2/9/2022 |
| Next Release Date: Suspended |