|
Download Data (XLS File) |
|
|||||
|
|||||
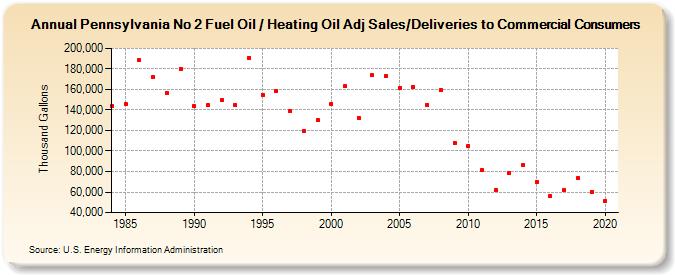
| Pennsylvania No 2 Fuel Oil / Heating Oil Adj Sales/Deliveries to Commercial Consumers (Thousand Gallons) | |||||
| Decade | Year-0 | Year-1 | Year-2 | Year-3 | Year-4 | Year-5 | Year-6 | Year-7 | Year-8 | Year-9 |
|---|---|---|---|---|---|---|---|---|---|---|
| 1980's | 143,956 | 145,573 | 188,257 | 171,792 | 156,908 | 180,273 | ||||
| 1990's | 143,638 | 144,376 | 149,741 | 144,866 | 191,041 | 154,914 | 158,731 | 138,672 | 119,285 | 130,141 |
| 2000's | 145,832 | 163,007 | 132,554 | 173,670 | 172,979 | 161,627 | 162,589 | 145,087 | 159,209 | 108,205 |
| 2010's | 104,982 | 81,423 | 61,898 | 78,487 | 85,899 | 69,886 | 56,072 | 61,646 | 73,624 | 60,327 |
| 2020's | 51,701 |
| - = No Data Reported; -- = Not Applicable; NA = Not Available; W = Withheld to avoid disclosure of individual company data. |
| Release Date: 2/9/2022 |
| Next Release Date: Suspended |