|
Download Data (XLS File) |
|
|||||
|
|||||
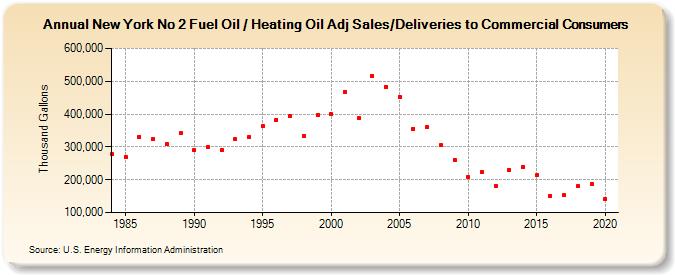
| New York No 2 Fuel Oil / Heating Oil Adj Sales/Deliveries to Commercial Consumers (Thousand Gallons) | |||||
| Decade | Year-0 | Year-1 | Year-2 | Year-3 | Year-4 | Year-5 | Year-6 | Year-7 | Year-8 | Year-9 |
|---|---|---|---|---|---|---|---|---|---|---|
| 1980's | 277,760 | 270,488 | 330,927 | 324,560 | 308,770 | 341,050 | ||||
| 1990's | 289,930 | 299,125 | 290,150 | 323,070 | 330,771 | 364,296 | 382,682 | 393,027 | 333,265 | 396,455 |
| 2000's | 400,386 | 467,421 | 388,715 | 515,212 | 483,739 | 453,308 | 355,839 | 359,257 | 304,926 | 260,942 |
| 2010's | 209,035 | 224,078 | 182,234 | 231,130 | 238,953 | 213,616 | 151,164 | 152,699 | 179,788 | 187,783 |
| 2020's | 141,610 |
| - = No Data Reported; -- = Not Applicable; NA = Not Available; W = Withheld to avoid disclosure of individual company data. |
| Release Date: 2/9/2022 |
| Next Release Date: Suspended |