|
Download Data (XLS File) |
|
|||||
|
|||||
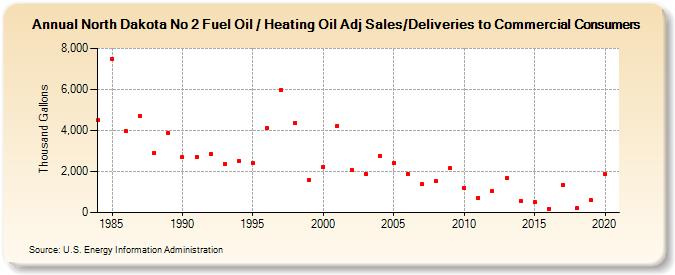
| North Dakota No 2 Fuel Oil / Heating Oil Adj Sales/Deliveries to Commercial Consumers (Thousand Gallons) | |||||
| Decade | Year-0 | Year-1 | Year-2 | Year-3 | Year-4 | Year-5 | Year-6 | Year-7 | Year-8 | Year-9 |
|---|---|---|---|---|---|---|---|---|---|---|
| 1980's | 4,508 | 7,505 | 3,962 | 4,724 | 2,923 | 3,879 | ||||
| 1990's | 2,685 | 2,709 | 2,846 | 2,370 | 2,535 | 2,392 | 4,118 | 5,976 | 4,387 | 1,607 |
| 2000's | 2,240 | 4,220 | 2,088 | 1,889 | 2,767 | 2,415 | 1,889 | 1,381 | 1,520 | 2,166 |
| 2010's | 1,219 | 727 | 1,038 | 1,679 | 577 | 506 | 190 | 1,359 | 207 | 597 |
| 2020's | 1,859 |
| - = No Data Reported; -- = Not Applicable; NA = Not Available; W = Withheld to avoid disclosure of individual company data. |
| Release Date: 2/9/2022 |
| Next Release Date: Suspended |