|
Download Data (XLS File) |
|
|||||
|
|||||
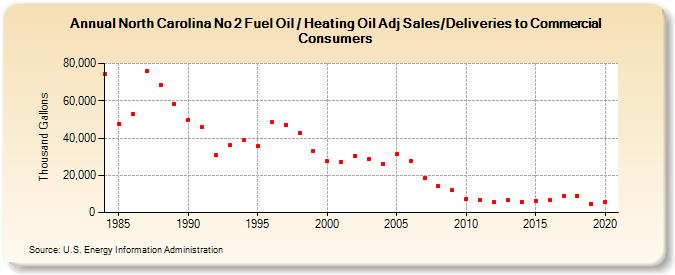
| North Carolina No 2 Fuel Oil / Heating Oil Adj Sales/Deliveries to Commercial Consumers (Thousand Gallons) | |||||
| Decade | Year-0 | Year-1 | Year-2 | Year-3 | Year-4 | Year-5 | Year-6 | Year-7 | Year-8 | Year-9 |
|---|---|---|---|---|---|---|---|---|---|---|
| 1980's | 74,486 | 47,275 | 52,950 | 75,956 | 68,676 | 58,495 | ||||
| 1990's | 49,763 | 45,817 | 30,699 | 36,225 | 38,799 | 35,586 | 48,826 | 47,225 | 42,609 | 32,955 |
| 2000's | 27,412 | 27,203 | 30,580 | 28,722 | 26,310 | 31,288 | 27,527 | 18,338 | 14,094 | 11,928 |
| 2010's | 7,363 | 6,956 | 5,486 | 6,579 | 5,855 | 6,419 | 6,960 | 8,696 | 9,105 | 4,542 |
| 2020's | 5,930 |
| - = No Data Reported; -- = Not Applicable; NA = Not Available; W = Withheld to avoid disclosure of individual company data. |
| Release Date: 2/9/2022 |
| Next Release Date: Suspended |