|
Download Data (XLS File) |
|
|||||
|
|||||
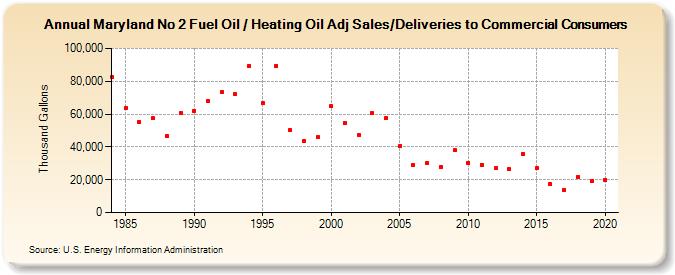
| Maryland No 2 Fuel Oil / Heating Oil Adj Sales/Deliveries to Commercial Consumers (Thousand Gallons) | |||||
| Decade | Year-0 | Year-1 | Year-2 | Year-3 | Year-4 | Year-5 | Year-6 | Year-7 | Year-8 | Year-9 |
|---|---|---|---|---|---|---|---|---|---|---|
| 1980's | 82,624 | 63,953 | 55,031 | 57,305 | 46,654 | 60,794 | ||||
| 1990's | 62,072 | 68,142 | 73,573 | 71,948 | 89,368 | 66,435 | 89,481 | 50,345 | 43,694 | 45,913 |
| 2000's | 64,895 | 54,843 | 47,310 | 60,577 | 57,391 | 40,451 | 28,871 | 30,322 | 27,885 | 37,993 |
| 2010's | 30,381 | 29,171 | 26,987 | 26,369 | 35,959 | 27,137 | 17,180 | 14,006 | 21,926 | 19,048 |
| 2020's | 19,830 |
| - = No Data Reported; -- = Not Applicable; NA = Not Available; W = Withheld to avoid disclosure of individual company data. |
| Release Date: 2/9/2022 |
| Next Release Date: Suspended |