|
Download Data (XLS File) |
|
|||||
|
|||||
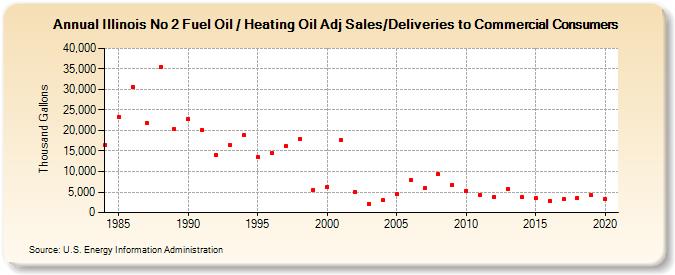
| Illinois No 2 Fuel Oil / Heating Oil Adj Sales/Deliveries to Commercial Consumers (Thousand Gallons) | |||||
| Decade | Year-0 | Year-1 | Year-2 | Year-3 | Year-4 | Year-5 | Year-6 | Year-7 | Year-8 | Year-9 |
|---|---|---|---|---|---|---|---|---|---|---|
| 1980's | 16,513 | 23,308 | 30,572 | 21,892 | 35,390 | 20,404 | ||||
| 1990's | 22,789 | 20,125 | 13,993 | 16,427 | 18,776 | 13,551 | 14,545 | 16,190 | 18,020 | 5,440 |
| 2000's | 6,247 | 17,733 | 5,037 | 2,152 | 3,049 | 4,504 | 7,925 | 5,895 | 9,340 | 6,791 |
| 2010's | 5,314 | 4,220 | 3,906 | 5,785 | 3,717 | 3,461 | 2,891 | 3,215 | 3,644 | 4,195 |
| 2020's | 3,255 |
| - = No Data Reported; -- = Not Applicable; NA = Not Available; W = Withheld to avoid disclosure of individual company data. |
| Release Date: 2/9/2022 |
| Next Release Date: Suspended |