|
Download Data (XLS File) |
|
|||||
|
|||||
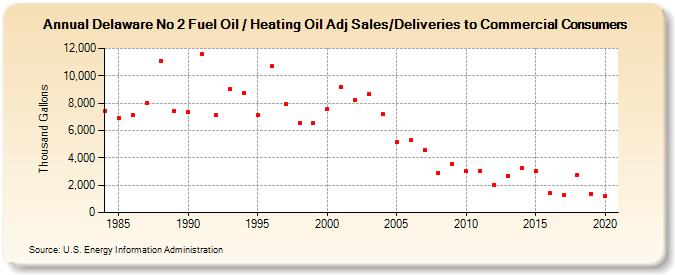
| Delaware No 2 Fuel Oil / Heating Oil Adj Sales/Deliveries to Commercial Consumers (Thousand Gallons) | |||||
| Decade | Year-0 | Year-1 | Year-2 | Year-3 | Year-4 | Year-5 | Year-6 | Year-7 | Year-8 | Year-9 |
|---|---|---|---|---|---|---|---|---|---|---|
| 1980's | 7,436 | 6,919 | 7,136 | 8,014 | 11,096 | 7,395 | ||||
| 1990's | 7,380 | 11,586 | 7,107 | 9,007 | 8,720 | 7,115 | 10,684 | 7,914 | 6,564 | 6,530 |
| 2000's | 7,563 | 9,192 | 8,257 | 8,651 | 7,168 | 5,174 | 5,272 | 4,548 | 2,893 | 3,576 |
| 2010's | 3,013 | 3,068 | 2,043 | 2,697 | 3,228 | 3,051 | 1,399 | 1,256 | 2,775 | 1,376 |
| 2020's | 1,197 |
| - = No Data Reported; -- = Not Applicable; NA = Not Available; W = Withheld to avoid disclosure of individual company data. |
| Release Date: 2/9/2022 |
| Next Release Date: Suspended |