|
Download Data (XLS File) |
|
|||||
|
|||||
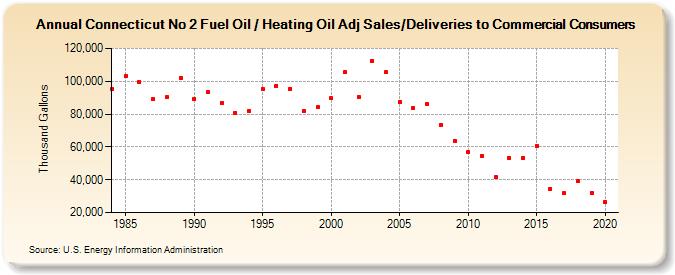
| Connecticut No 2 Fuel Oil / Heating Oil Adj Sales/Deliveries to Commercial Consumers (Thousand Gallons) | |||||
| Decade | Year-0 | Year-1 | Year-2 | Year-3 | Year-4 | Year-5 | Year-6 | Year-7 | Year-8 | Year-9 |
|---|---|---|---|---|---|---|---|---|---|---|
| 1980's | 95,125 | 103,269 | 99,601 | 89,122 | 90,200 | 101,831 | ||||
| 1990's | 89,268 | 93,363 | 87,014 | 80,943 | 82,020 | 95,205 | 97,372 | 95,501 | 81,607 | 84,213 |
| 2000's | 89,616 | 105,459 | 90,586 | 112,493 | 105,375 | 87,372 | 83,561 | 85,895 | 73,370 | 63,654 |
| 2010's | 56,605 | 54,740 | 41,666 | 53,145 | 53,406 | 60,583 | 34,391 | 31,676 | 39,068 | 32,038 |
| 2020's | 26,557 |
| - = No Data Reported; -- = Not Applicable; NA = Not Available; W = Withheld to avoid disclosure of individual company data. |
| Release Date: 2/9/2022 |
| Next Release Date: Suspended |