|
Download Data (XLS File) |
|
|||||
|
|||||
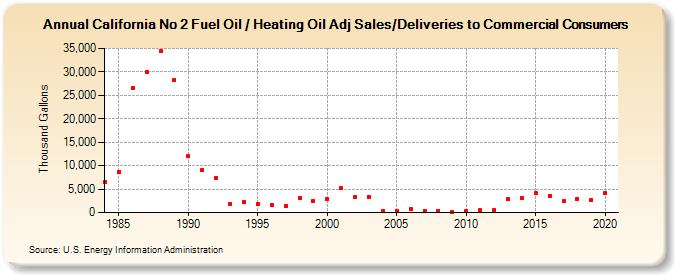
| California No 2 Fuel Oil / Heating Oil Adj Sales/Deliveries to Commercial Consumers (Thousand Gallons) | |||||
| Decade | Year-0 | Year-1 | Year-2 | Year-3 | Year-4 | Year-5 | Year-6 | Year-7 | Year-8 | Year-9 |
|---|---|---|---|---|---|---|---|---|---|---|
| 1980's | 6,546 | 8,654 | 26,651 | 29,961 | 34,406 | 28,323 | ||||
| 1990's | 11,965 | 9,056 | 7,444 | 1,830 | 2,293 | 1,832 | 1,603 | 1,472 | 3,052 | 2,541 |
| 2000's | 2,866 | 5,189 | 3,307 | 3,267 | 335 | 430 | 728 | 415 | 395 | 196 |
| 2010's | 388 | 541 | 558 | 2,957 | 3,099 | 4,067 | 3,554 | 2,407 | 2,971 | 2,699 |
| 2020's | 4,081 |
| - = No Data Reported; -- = Not Applicable; NA = Not Available; W = Withheld to avoid disclosure of individual company data. |
| Release Date: 2/9/2022 |
| Next Release Date: Suspended |