|
Download Data (XLS File) |
|
|||||
|
|||||
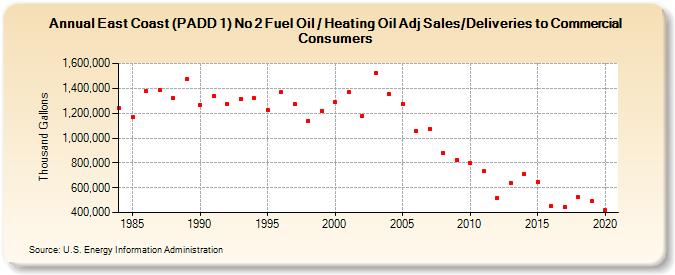
| East Coast (PADD 1) No 2 Fuel Oil / Heating Oil Adj Sales/Deliveries to Commercial Consumers (Thousand Gallons) | |||||
| Decade | Year-0 | Year-1 | Year-2 | Year-3 | Year-4 | Year-5 | Year-6 | Year-7 | Year-8 | Year-9 |
|---|---|---|---|---|---|---|---|---|---|---|
| 1980's | 1,239,159 | 1,173,104 | 1,376,435 | 1,384,875 | 1,318,479 | 1,472,512 | ||||
| 1990's | 1,269,685 | 1,340,203 | 1,277,698 | 1,313,608 | 1,318,678 | 1,224,225 | 1,366,539 | 1,273,043 | 1,140,090 | 1,219,850 |
| 2000's | 1,287,636 | 1,371,659 | 1,176,826 | 1,521,938 | 1,352,924 | 1,270,654 | 1,056,493 | 1,075,018 | 879,577 | 825,194 |
| 2010's | 801,443 | 731,498 | 520,232 | 641,250 | 711,405 | 648,109 | 454,217 | 444,480 | 521,534 | 492,591 |
| 2020's | 417,507 |
| - = No Data Reported; -- = Not Applicable; NA = Not Available; W = Withheld to avoid disclosure of individual company data. |
| Release Date: 2/9/2022 |
| Next Release Date: Suspended |