|
Download Data (XLS File) |
|
|||||
|
|||||
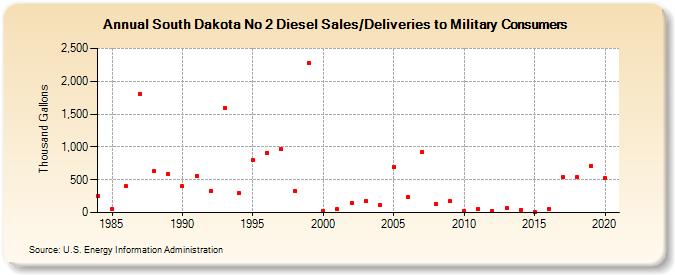
| South Dakota No 2 Diesel Sales/Deliveries to Military Consumers (Thousand Gallons) | |||||
| Decade | Year-0 | Year-1 | Year-2 | Year-3 | Year-4 | Year-5 | Year-6 | Year-7 | Year-8 | Year-9 |
|---|---|---|---|---|---|---|---|---|---|---|
| 1980's | 248 | 52 | 399 | 1,810 | 628 | 585 | ||||
| 1990's | 398 | 564 | 331 | 1,596 | 297 | 797 | 907 | 961 | 329 | 2,285 |
| 2000's | 17 | 49 | 153 | 177 | 114 | 696 | 234 | 927 | 131 | 171 |
| 2010's | 20 | 53 | 24 | 71 | 38 | 1 | 56 | 537 | 536 | 709 |
| 2020's | 520 |
| - = No Data Reported; -- = Not Applicable; NA = Not Available; W = Withheld to avoid disclosure of individual company data. |
| Release Date: 2/9/2022 |
| Next Release Date: Suspended |