|
Download Data (XLS File) |
|
|||||
|
|||||
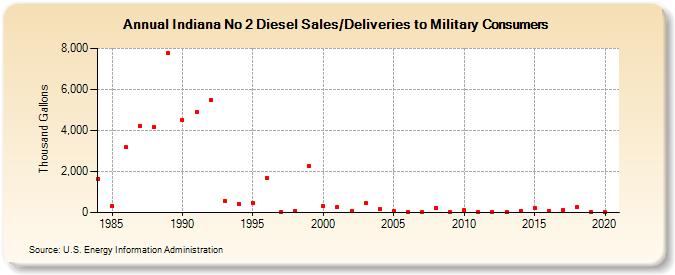
| Indiana No 2 Diesel Sales/Deliveries to Military Consumers (Thousand Gallons) | |||||
| Decade | Year-0 | Year-1 | Year-2 | Year-3 | Year-4 | Year-5 | Year-6 | Year-7 | Year-8 | Year-9 |
|---|---|---|---|---|---|---|---|---|---|---|
| 1980's | 1,656 | 312 | 3,171 | 4,216 | 4,176 | 7,760 | ||||
| 1990's | 4,512 | 4,891 | 5,487 | 583 | 402 | 458 | 1,687 | 38 | 97 | 2,255 |
| 2000's | 298 | 265 | 55 | 465 | 171 | 69 | 20 | 12 | 225 | 46 |
| 2010's | 121 | 31 | 45 | 40 | 79 | 243 | 69 | 126 | 271 | 19 |
| 2020's | 14 |
| - = No Data Reported; -- = Not Applicable; NA = Not Available; W = Withheld to avoid disclosure of individual company data. |
| Release Date: 2/9/2022 |
| Next Release Date: Suspended |