|
Download Data (XLS File) |
|
|||||
|
|||||
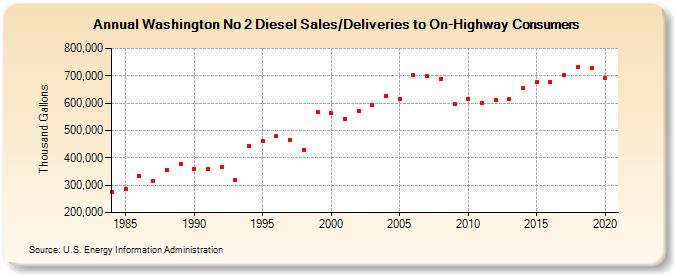
| Washington No 2 Diesel Sales/Deliveries to On-Highway Consumers (Thousand Gallons) | |||||
| Decade | Year-0 | Year-1 | Year-2 | Year-3 | Year-4 | Year-5 | Year-6 | Year-7 | Year-8 | Year-9 |
|---|---|---|---|---|---|---|---|---|---|---|
| 1980's | 275,452 | 287,006 | 332,326 | 314,460 | 357,017 | 378,110 | ||||
| 1990's | 358,744 | 357,723 | 368,334 | 319,451 | 444,512 | 463,325 | 479,251 | 466,854 | 429,381 | 568,852 |
| 2000's | 562,643 | 543,001 | 570,344 | 593,610 | 627,130 | 613,605 | 701,943 | 697,898 | 688,302 | 597,401 |
| 2010's | 616,779 | 598,655 | 612,979 | 614,588 | 656,880 | 675,752 | 677,574 | 702,524 | 731,479 | 729,066 |
| 2020's | 690,826 |
| - = No Data Reported; -- = Not Applicable; NA = Not Available; W = Withheld to avoid disclosure of individual company data. |
| Release Date: 2/9/2022 |
| Next Release Date: Suspended |