|
Download Data (XLS File) |
|
|||||
|
|||||
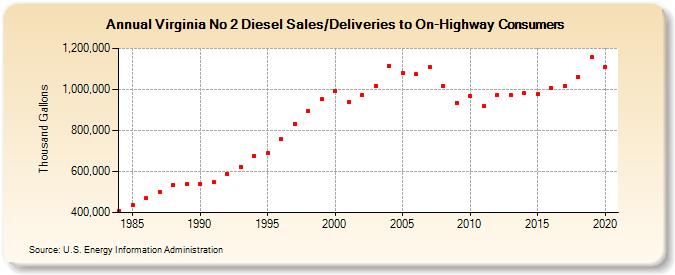
| Virginia No 2 Diesel Sales/Deliveries to On-Highway Consumers (Thousand Gallons) | |||||
| Decade | Year-0 | Year-1 | Year-2 | Year-3 | Year-4 | Year-5 | Year-6 | Year-7 | Year-8 | Year-9 |
|---|---|---|---|---|---|---|---|---|---|---|
| 1980's | 408,060 | 437,519 | 468,608 | 501,785 | 532,848 | 537,569 | ||||
| 1990's | 540,468 | 547,591 | 586,726 | 623,277 | 676,118 | 688,044 | 757,666 | 832,903 | 895,185 | 952,594 |
| 2000's | 992,580 | 936,738 | 973,906 | 1,015,930 | 1,115,628 | 1,080,515 | 1,072,989 | 1,111,050 | 1,017,285 | 935,552 |
| 2010's | 969,057 | 917,431 | 971,673 | 971,903 | 980,598 | 979,623 | 1,008,083 | 1,016,951 | 1,062,921 | 1,157,450 |
| 2020's | 1,108,160 |
| - = No Data Reported; -- = Not Applicable; NA = Not Available; W = Withheld to avoid disclosure of individual company data. |
| Release Date: 2/9/2022 |
| Next Release Date: Suspended |