|
Download Data (XLS File) |
|
|||||
|
|||||
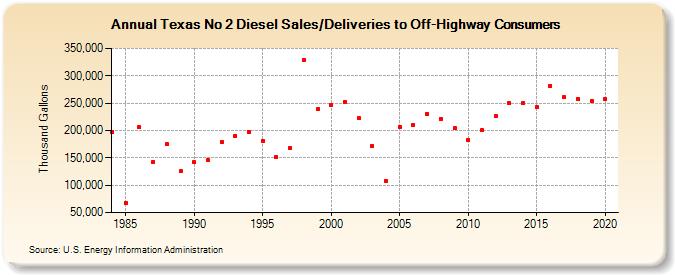
| Texas No 2 Diesel Sales/Deliveries to Off-Highway Consumers (Thousand Gallons) | |||||
| Decade | Year-0 | Year-1 | Year-2 | Year-3 | Year-4 | Year-5 | Year-6 | Year-7 | Year-8 | Year-9 |
|---|---|---|---|---|---|---|---|---|---|---|
| 1980's | 196,765 | 67,528 | 205,796 | 142,596 | 174,734 | 125,047 | ||||
| 1990's | 141,836 | 145,607 | 179,479 | 190,794 | 197,985 | 181,065 | 150,666 | 168,077 | 328,682 | 238,874 |
| 2000's | 247,198 | 252,844 | 222,432 | 171,454 | 107,704 | 206,625 | 210,016 | 230,926 | 221,572 | 203,983 |
| 2010's | 182,689 | 200,112 | 226,200 | 250,172 | 249,951 | 242,435 | 281,790 | 260,573 | 258,396 | 254,230 |
| 2020's | 257,232 |
| - = No Data Reported; -- = Not Applicable; NA = Not Available; W = Withheld to avoid disclosure of individual company data. |
| Release Date: 2/9/2022 |
| Next Release Date: Suspended |