|
Download Data (XLS File) |
|
|||||
|
|||||
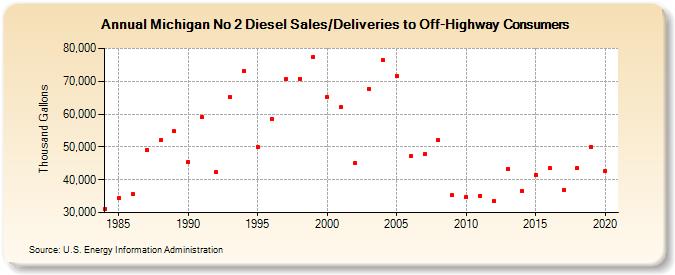
| Michigan No 2 Diesel Sales/Deliveries to Off-Highway Consumers (Thousand Gallons) | |||||
| Decade | Year-0 | Year-1 | Year-2 | Year-3 | Year-4 | Year-5 | Year-6 | Year-7 | Year-8 | Year-9 |
|---|---|---|---|---|---|---|---|---|---|---|
| 1980's | 31,136 | 34,530 | 35,543 | 48,955 | 51,988 | 54,695 | ||||
| 1990's | 45,459 | 59,049 | 42,212 | 65,246 | 73,038 | 49,973 | 58,458 | 70,670 | 70,799 | 77,439 |
| 2000's | 65,133 | 62,003 | 45,223 | 67,658 | 76,377 | 71,660 | 47,082 | 47,782 | 52,039 | 35,267 |
| 2010's | 34,737 | 35,147 | 33,514 | 43,415 | 36,621 | 41,437 | 43,478 | 36,972 | 43,562 | 49,897 |
| 2020's | 42,562 |
| - = No Data Reported; -- = Not Applicable; NA = Not Available; W = Withheld to avoid disclosure of individual company data. |
| Release Date: 2/9/2022 |
| Next Release Date: Suspended |