|
Download Data (XLS File) |
|
|||||
|
|||||
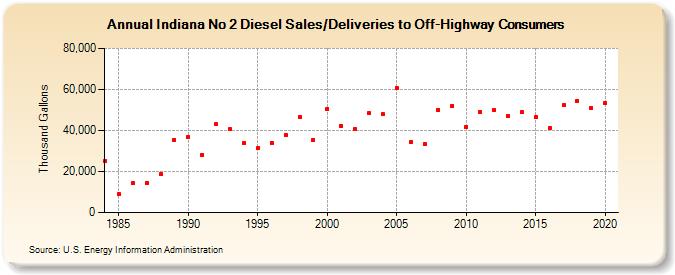
| Indiana No 2 Diesel Sales/Deliveries to Off-Highway Consumers (Thousand Gallons) | |||||
| Decade | Year-0 | Year-1 | Year-2 | Year-3 | Year-4 | Year-5 | Year-6 | Year-7 | Year-8 | Year-9 |
|---|---|---|---|---|---|---|---|---|---|---|
| 1980's | 25,150 | 9,021 | 14,190 | 14,475 | 18,775 | 35,500 | ||||
| 1990's | 37,013 | 28,292 | 42,988 | 40,536 | 33,790 | 31,444 | 33,958 | 37,858 | 46,637 | 35,415 |
| 2000's | 50,519 | 42,187 | 40,565 | 48,293 | 47,876 | 60,750 | 34,253 | 33,460 | 50,166 | 52,110 |
| 2010's | 41,855 | 49,234 | 49,992 | 47,294 | 48,900 | 46,462 | 41,208 | 52,316 | 54,565 | 50,862 |
| 2020's | 53,311 |
| - = No Data Reported; -- = Not Applicable; NA = Not Available; W = Withheld to avoid disclosure of individual company data. |
| Release Date: 2/9/2022 |
| Next Release Date: Suspended |