|
Download Data (XLS File) |
|
|||||
|
|||||
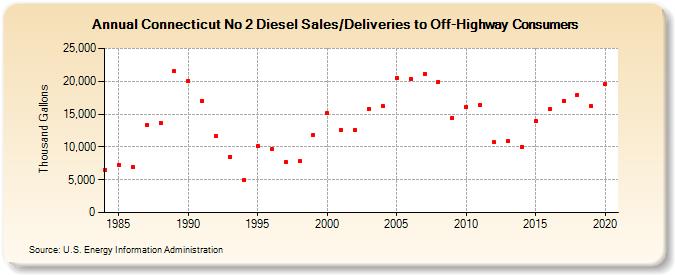
| Connecticut No 2 Diesel Sales/Deliveries to Off-Highway Consumers (Thousand Gallons) | |||||
| Decade | Year-0 | Year-1 | Year-2 | Year-3 | Year-4 | Year-5 | Year-6 | Year-7 | Year-8 | Year-9 |
|---|---|---|---|---|---|---|---|---|---|---|
| 1980's | 6,529 | 7,249 | 7,011 | 13,335 | 13,653 | 21,512 | ||||
| 1990's | 20,093 | 17,042 | 11,590 | 8,535 | 4,923 | 10,101 | 9,660 | 7,760 | 7,854 | 11,833 |
| 2000's | 15,121 | 12,588 | 12,556 | 15,810 | 16,223 | 20,506 | 20,354 | 21,159 | 19,948 | 14,456 |
| 2010's | 16,124 | 16,435 | 10,683 | 10,868 | 10,058 | 13,872 | 15,756 | 17,031 | 17,918 | 16,216 |
| 2020's | 19,523 |
| - = No Data Reported; -- = Not Applicable; NA = Not Available; W = Withheld to avoid disclosure of individual company data. |
| Release Date: 2/9/2022 |
| Next Release Date: Suspended |