|
Download Data (XLS File) |
|
|||||
|
|||||
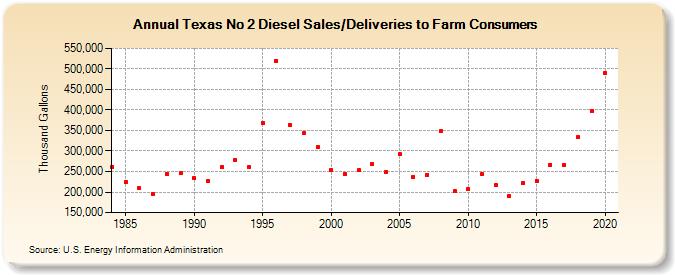
| Texas No 2 Diesel Sales/Deliveries to Farm Consumers (Thousand Gallons) | |||||
| Decade | Year-0 | Year-1 | Year-2 | Year-3 | Year-4 | Year-5 | Year-6 | Year-7 | Year-8 | Year-9 |
|---|---|---|---|---|---|---|---|---|---|---|
| 1980's | 261,981 | 224,500 | 209,048 | 195,490 | 243,962 | 245,439 | ||||
| 1990's | 234,061 | 227,693 | 260,767 | 279,018 | 260,751 | 368,821 | 520,481 | 363,502 | 343,751 | 309,839 |
| 2000's | 253,491 | 244,150 | 252,909 | 267,327 | 249,810 | 292,274 | 237,142 | 242,322 | 348,361 | 201,769 |
| 2010's | 207,183 | 243,170 | 216,915 | 190,565 | 222,849 | 227,902 | 266,578 | 266,058 | 333,570 | 398,037 |
| 2020's | 490,785 |
| - = No Data Reported; -- = Not Applicable; NA = Not Available; W = Withheld to avoid disclosure of individual company data. |
| Release Date: 2/9/2022 |
| Next Release Date: Suspended |