|
Download Data (XLS File) |
|
|||||
|
|||||
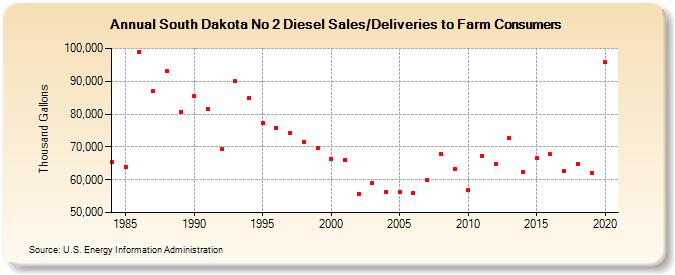
| South Dakota No 2 Diesel Sales/Deliveries to Farm Consumers (Thousand Gallons) | |||||
| Decade | Year-0 | Year-1 | Year-2 | Year-3 | Year-4 | Year-5 | Year-6 | Year-7 | Year-8 | Year-9 |
|---|---|---|---|---|---|---|---|---|---|---|
| 1980's | 65,392 | 63,990 | 99,033 | 86,969 | 93,142 | 80,500 | ||||
| 1990's | 85,415 | 81,389 | 69,401 | 90,015 | 84,840 | 77,243 | 75,886 | 74,279 | 71,623 | 69,618 |
| 2000's | 66,237 | 66,099 | 55,672 | 58,881 | 56,204 | 56,131 | 55,949 | 59,835 | 67,897 | 63,165 |
| 2010's | 56,899 | 67,198 | 64,939 | 72,781 | 62,315 | 66,526 | 67,694 | 62,785 | 64,827 | 62,027 |
| 2020's | 95,949 |
| - = No Data Reported; -- = Not Applicable; NA = Not Available; W = Withheld to avoid disclosure of individual company data. |
| Release Date: 2/9/2022 |
| Next Release Date: Suspended |