|
Download Data (XLS File) |
|
|||||
|
|||||
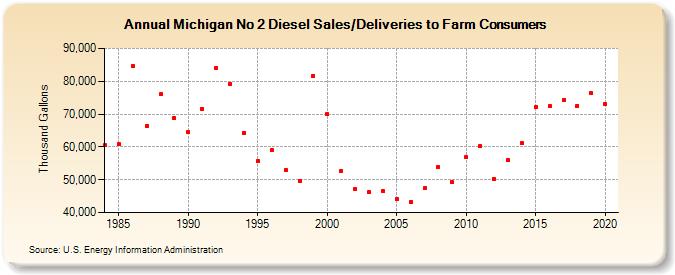
| Michigan No 2 Diesel Sales/Deliveries to Farm Consumers (Thousand Gallons) | |||||
| Decade | Year-0 | Year-1 | Year-2 | Year-3 | Year-4 | Year-5 | Year-6 | Year-7 | Year-8 | Year-9 |
|---|---|---|---|---|---|---|---|---|---|---|
| 1980's | 60,465 | 60,742 | 84,500 | 66,358 | 75,974 | 68,652 | ||||
| 1990's | 64,426 | 71,647 | 84,034 | 79,242 | 64,315 | 55,647 | 59,032 | 53,005 | 49,673 | 81,700 |
| 2000's | 69,919 | 52,782 | 47,166 | 46,110 | 46,479 | 44,016 | 43,183 | 47,329 | 53,828 | 49,200 |
| 2010's | 56,779 | 60,122 | 50,302 | 55,876 | 61,058 | 72,013 | 72,307 | 74,316 | 72,596 | 76,272 |
| 2020's | 73,083 |
| - = No Data Reported; -- = Not Applicable; NA = Not Available; W = Withheld to avoid disclosure of individual company data. |
| Release Date: 2/9/2022 |
| Next Release Date: Suspended |