|
Download Data (XLS File) |
|
|||||
|
|||||
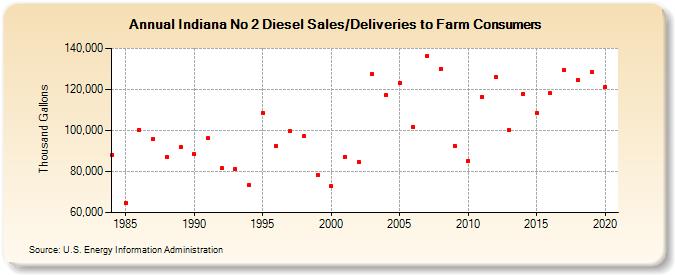
| Indiana No 2 Diesel Sales/Deliveries to Farm Consumers (Thousand Gallons) | |||||
| Decade | Year-0 | Year-1 | Year-2 | Year-3 | Year-4 | Year-5 | Year-6 | Year-7 | Year-8 | Year-9 |
|---|---|---|---|---|---|---|---|---|---|---|
| 1980's | 88,055 | 64,654 | 100,242 | 96,046 | 87,050 | 91,895 | ||||
| 1990's | 88,467 | 96,159 | 81,586 | 81,003 | 73,375 | 108,684 | 92,540 | 99,543 | 97,147 | 78,093 |
| 2000's | 72,867 | 87,311 | 84,560 | 127,443 | 117,370 | 123,113 | 101,870 | 136,331 | 130,194 | 92,486 |
| 2010's | 85,257 | 116,498 | 126,061 | 100,119 | 117,996 | 108,574 | 118,248 | 129,659 | 124,791 | 128,325 |
| 2020's | 121,238 |
| - = No Data Reported; -- = Not Applicable; NA = Not Available; W = Withheld to avoid disclosure of individual company data. |
| Release Date: 2/9/2022 |
| Next Release Date: Suspended |