|
Download Data (XLS File) |
|
|||||
|
|||||
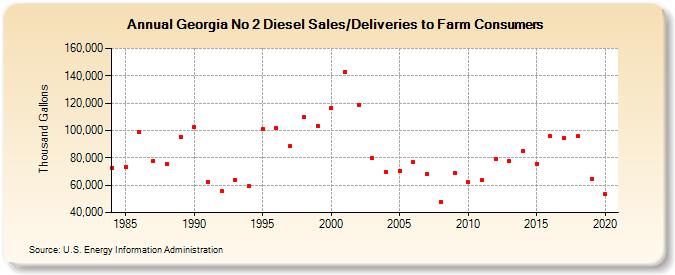
| Georgia No 2 Diesel Sales/Deliveries to Farm Consumers (Thousand Gallons) | |||||
| Decade | Year-0 | Year-1 | Year-2 | Year-3 | Year-4 | Year-5 | Year-6 | Year-7 | Year-8 | Year-9 |
|---|---|---|---|---|---|---|---|---|---|---|
| 1980's | 72,767 | 73,267 | 98,718 | 77,518 | 75,132 | 95,368 | ||||
| 1990's | 102,201 | 62,537 | 55,556 | 63,821 | 59,329 | 101,028 | 101,643 | 88,393 | 109,881 | 103,490 |
| 2000's | 116,746 | 142,755 | 118,586 | 80,059 | 69,856 | 70,280 | 76,974 | 68,172 | 47,824 | 69,053 |
| 2010's | 62,281 | 63,725 | 79,470 | 77,750 | 85,329 | 75,511 | 95,889 | 94,680 | 95,700 | 64,473 |
| 2020's | 53,432 |
| - = No Data Reported; -- = Not Applicable; NA = Not Available; W = Withheld to avoid disclosure of individual company data. |
| Release Date: 2/9/2022 |
| Next Release Date: Suspended |