|
Download Data (XLS File) |
|
|||||
|
|||||
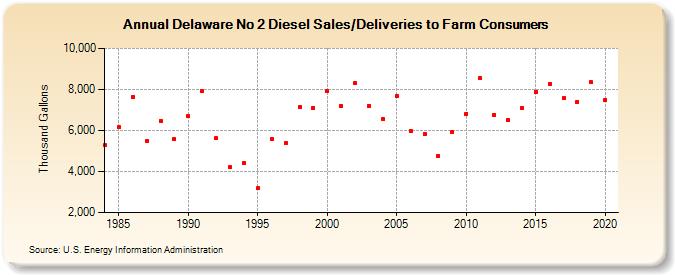
| Delaware No 2 Diesel Sales/Deliveries to Farm Consumers (Thousand Gallons) | |||||
| Decade | Year-0 | Year-1 | Year-2 | Year-3 | Year-4 | Year-5 | Year-6 | Year-7 | Year-8 | Year-9 |
|---|---|---|---|---|---|---|---|---|---|---|
| 1980's | 5,271 | 6,149 | 7,642 | 5,493 | 6,480 | 5,580 | ||||
| 1990's | 6,683 | 7,901 | 5,609 | 4,205 | 4,417 | 3,179 | 5,574 | 5,378 | 7,150 | 7,116 |
| 2000's | 7,915 | 7,185 | 8,320 | 7,210 | 6,547 | 7,669 | 5,993 | 5,839 | 4,762 | 5,903 |
| 2010's | 6,821 | 8,541 | 6,767 | 6,522 | 7,106 | 7,893 | 8,281 | 7,563 | 7,405 | 8,348 |
| 2020's | 7,492 |
| - = No Data Reported; -- = Not Applicable; NA = Not Available; W = Withheld to avoid disclosure of individual company data. |
| Release Date: 2/9/2022 |
| Next Release Date: Suspended |