|
Download Data (XLS File) |
|
|||||
|
|||||
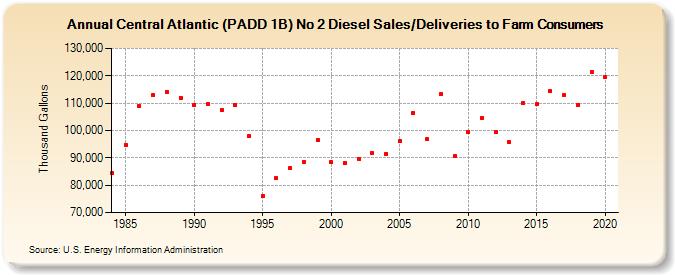
| Central Atlantic (PADD 1B) No 2 Diesel Sales/Deliveries to Farm Consumers (Thousand Gallons) | |||||
| Decade | Year-0 | Year-1 | Year-2 | Year-3 | Year-4 | Year-5 | Year-6 | Year-7 | Year-8 | Year-9 |
|---|---|---|---|---|---|---|---|---|---|---|
| 1980's | 84,430 | 94,784 | 108,894 | 112,895 | 114,146 | 112,012 | ||||
| 1990's | 109,458 | 109,613 | 107,564 | 109,252 | 97,956 | 76,036 | 82,480 | 86,319 | 88,634 | 96,663 |
| 2000's | 88,468 | 88,209 | 89,399 | 91,810 | 91,502 | 96,234 | 106,327 | 96,794 | 113,257 | 90,495 |
| 2010's | 99,578 | 104,693 | 99,395 | 95,653 | 110,027 | 109,666 | 114,340 | 112,833 | 109,335 | 121,347 |
| 2020's | 119,618 |
| - = No Data Reported; -- = Not Applicable; NA = Not Available; W = Withheld to avoid disclosure of individual company data. |
| Release Date: 2/9/2022 |
| Next Release Date: Suspended |