|
Download Data (XLS File) |
|
|||||
|
|||||
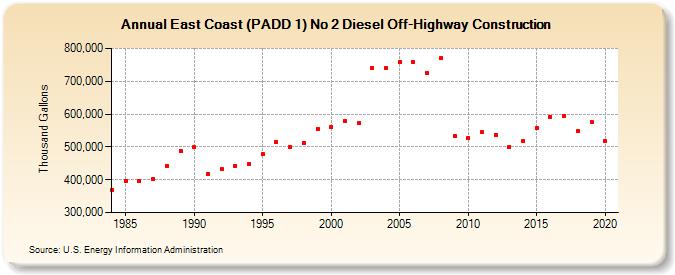
| East Coast (PADD 1) No 2 Diesel Off-Highway Construction (Thousand Gallons) | |||||
| Decade | Year-0 | Year-1 | Year-2 | Year-3 | Year-4 | Year-5 | Year-6 | Year-7 | Year-8 | Year-9 |
|---|---|---|---|---|---|---|---|---|---|---|
| 1980's | 368,184 | 396,569 | 397,609 | 401,919 | 442,854 | 488,476 | ||||
| 1990's | 498,358 | 417,960 | 432,940 | 441,483 | 446,914 | 477,710 | 514,219 | 499,309 | 513,113 | 555,415 |
| 2000's | 559,706 | 580,071 | 572,878 | 740,389 | 741,282 | 758,412 | 757,629 | 725,162 | 769,966 | 533,385 |
| 2010's | 528,372 | 544,185 | 536,255 | 500,447 | 516,940 | 558,916 | 592,253 | 595,107 | 547,744 | 576,491 |
| 2020's | 518,283 |
| - = No Data Reported; -- = Not Applicable; NA = Not Available; W = Withheld to avoid disclosure of individual company data. |
| Release Date: 2/9/2022 |
| Next Release Date: Suspended |