|
Download Data (XLS File) |
|
|||||
|
|||||
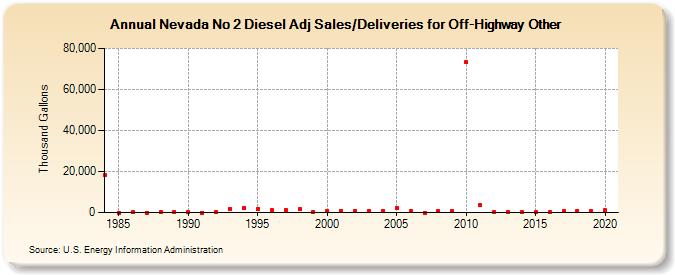
| Nevada No 2 Diesel Adj Sales/Deliveries for Off-Highway Other (Thousand Gallons) | |||||
| Decade | Year-0 | Year-1 | Year-2 | Year-3 | Year-4 | Year-5 | Year-6 | Year-7 | Year-8 | Year-9 |
|---|---|---|---|---|---|---|---|---|---|---|
| 1980's | 18,212 | 0 | 77 | 13 | 263 | 261 | ||||
| 1990's | 84 | 4 | 315 | 1,861 | 2,221 | 1,866 | 1,114 | 1,336 | 1,494 | 349 |
| 2000's | 918 | 874 | 668 | 788 | 993 | 2,413 | 570 | 6 | 531 | 678 |
| 2010's | 73,141 | 3,468 | 159 | 166 | 132 | 136 | 200 | 711 | 906 | 708 |
| 2020's | 1,080 |
| - = No Data Reported; -- = Not Applicable; NA = Not Available; W = Withheld to avoid disclosure of individual company data. |
| Release Date: 2/9/2022 |
| Next Release Date: Suspended |