|
Download Data (XLS File) |
|
|||||
|
|||||
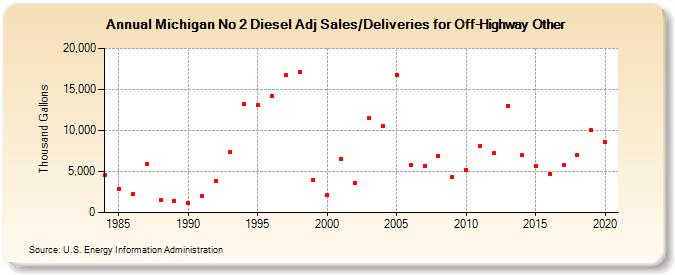
| Michigan No 2 Diesel Adj Sales/Deliveries for Off-Highway Other (Thousand Gallons) | |||||
| Decade | Year-0 | Year-1 | Year-2 | Year-3 | Year-4 | Year-5 | Year-6 | Year-7 | Year-8 | Year-9 |
|---|---|---|---|---|---|---|---|---|---|---|
| 1980's | 4,528 | 2,850 | 2,290 | 5,960 | 1,534 | 1,438 | ||||
| 1990's | 1,196 | 2,003 | 3,828 | 7,399 | 13,173 | 13,159 | 14,186 | 16,741 | 17,181 | 3,998 |
| 2000's | 2,194 | 6,564 | 3,608 | 11,520 | 10,540 | 16,802 | 5,777 | 5,686 | 6,916 | 4,319 |
| 2010's | 5,235 | 8,158 | 7,202 | 13,015 | 6,993 | 5,704 | 4,740 | 5,743 | 7,000 | 10,001 |
| 2020's | 8,640 |
| - = No Data Reported; -- = Not Applicable; NA = Not Available; W = Withheld to avoid disclosure of individual company data. |
| Release Date: 2/9/2022 |
| Next Release Date: Suspended |