|
Download Data (XLS File) |
|
|||||
|
|||||
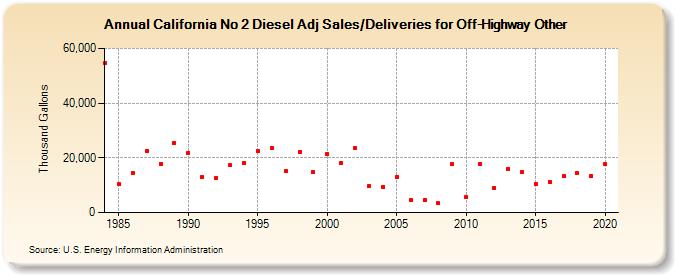
| California No 2 Diesel Adj Sales/Deliveries for Off-Highway Other (Thousand Gallons) | |||||
| Decade | Year-0 | Year-1 | Year-2 | Year-3 | Year-4 | Year-5 | Year-6 | Year-7 | Year-8 | Year-9 |
|---|---|---|---|---|---|---|---|---|---|---|
| 1980's | 54,493 | 10,319 | 14,473 | 22,503 | 17,794 | 25,418 | ||||
| 1990's | 21,931 | 13,061 | 12,801 | 17,223 | 18,263 | 22,581 | 23,659 | 15,237 | 22,312 | 14,663 |
| 2000's | 21,407 | 18,281 | 23,649 | 9,652 | 9,497 | 13,090 | 4,516 | 4,544 | 3,335 | 17,625 |
| 2010's | 5,567 | 17,769 | 9,009 | 16,034 | 14,658 | 10,311 | 11,176 | 13,289 | 14,306 | 13,352 |
| 2020's | 17,596 |
| - = No Data Reported; -- = Not Applicable; NA = Not Available; W = Withheld to avoid disclosure of individual company data. |
| Release Date: 2/9/2022 |
| Next Release Date: Suspended |