|
Download Data (XLS File) |
|
|||||
|
|||||
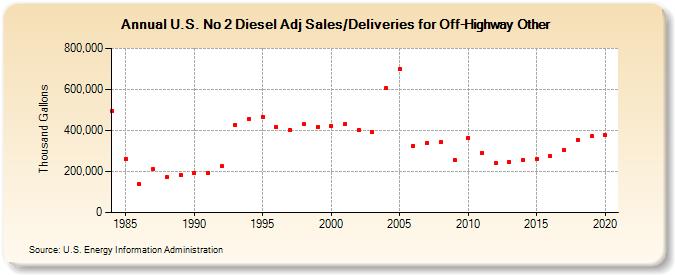
| U.S. No 2 Diesel Adj Sales/Deliveries for Off-Highway Other (Thousand Gallons) | |||||
| Decade | Year-0 | Year-1 | Year-2 | Year-3 | Year-4 | Year-5 | Year-6 | Year-7 | Year-8 | Year-9 |
|---|---|---|---|---|---|---|---|---|---|---|
| 1980's | 494,087 | 263,171 | 137,333 | 210,464 | 171,622 | 182,505 | ||||
| 1990's | 194,889 | 194,230 | 224,864 | 427,597 | 457,181 | 466,306 | 417,890 | 403,246 | 430,243 | 418,716 |
| 2000's | 423,280 | 429,484 | 402,852 | 391,647 | 605,095 | 700,543 | 326,368 | 340,275 | 342,632 | 256,357 |
| 2010's | 364,738 | 292,021 | 239,603 | 248,314 | 255,118 | 263,031 | 274,791 | 305,097 | 353,666 | 371,686 |
| 2020's | 377,617 |
| - = No Data Reported; -- = Not Applicable; NA = Not Available; W = Withheld to avoid disclosure of individual company data. |
| Release Date: 2/9/2022 |
| Next Release Date: Suspended |