|
Download Data (XLS File) |
|
|||||
|
|||||
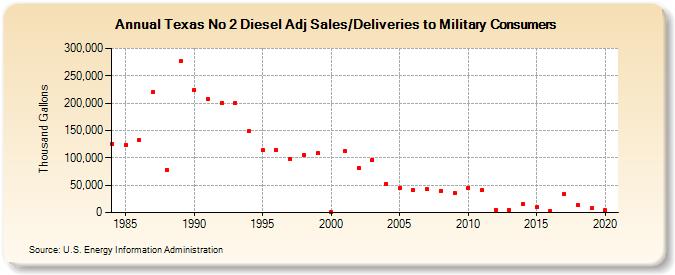
| Texas No 2 Diesel Adj Sales/Deliveries to Military Consumers (Thousand Gallons) | |||||
| Decade | Year-0 | Year-1 | Year-2 | Year-3 | Year-4 | Year-5 | Year-6 | Year-7 | Year-8 | Year-9 |
|---|---|---|---|---|---|---|---|---|---|---|
| 1980's | 125,746 | 123,792 | 132,969 | 219,833 | 78,555 | 276,348 | ||||
| 1990's | 223,961 | 207,897 | 201,021 | 199,776 | 148,984 | 113,668 | 114,539 | 97,642 | 105,924 | 108,230 |
| 2000's | 951 | 112,250 | 81,490 | 96,459 | 52,667 | 45,590 | 41,009 | 42,305 | 40,186 | 35,731 |
| 2010's | 45,503 | 40,779 | 5,277 | 4,432 | 16,115 | 9,899 | 3,002 | 33,496 | 13,750 | 7,785 |
| 2020's | 3,908 |
| - = No Data Reported; -- = Not Applicable; NA = Not Available; W = Withheld to avoid disclosure of individual company data. |
| Release Date: 2/9/2022 |
| Next Release Date: Suspended |