|
Download Data (XLS File) |
|
|||||
|
|||||
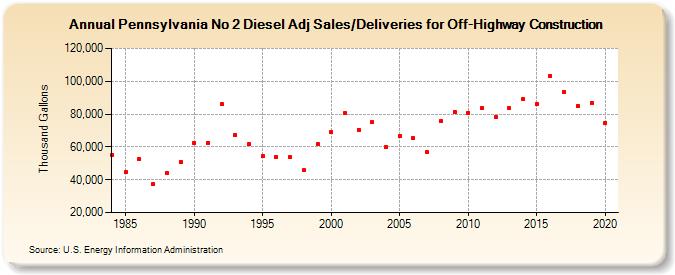
| Pennsylvania No 2 Diesel Adj Sales/Deliveries for Off-Highway Construction (Thousand Gallons) | |||||
| Decade | Year-0 | Year-1 | Year-2 | Year-3 | Year-4 | Year-5 | Year-6 | Year-7 | Year-8 | Year-9 |
|---|---|---|---|---|---|---|---|---|---|---|
| 1980's | 55,130 | 44,522 | 52,622 | 37,145 | 43,886 | 51,045 | ||||
| 1990's | 62,301 | 62,615 | 85,914 | 67,244 | 61,646 | 54,254 | 53,933 | 53,657 | 45,833 | 61,750 |
| 2000's | 69,043 | 80,613 | 70,522 | 74,979 | 60,039 | 66,543 | 65,177 | 56,631 | 75,844 | 81,334 |
| 2010's | 80,811 | 83,541 | 78,354 | 83,487 | 89,114 | 86,153 | 103,203 | 93,391 | 85,083 | 86,987 |
| 2020's | 74,423 |
| - = No Data Reported; -- = Not Applicable; NA = Not Available; W = Withheld to avoid disclosure of individual company data. |
| Release Date: 2/9/2022 |
| Next Release Date: Suspended |