|
Download Data (XLS File) |
|
|||||
|
|||||
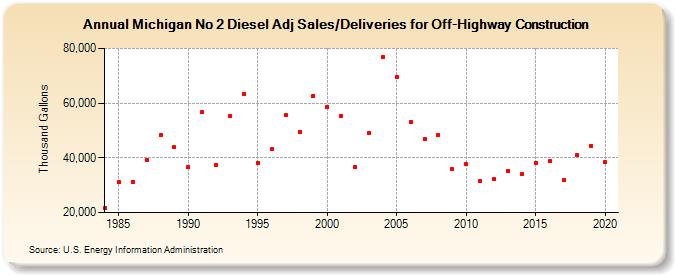
| Michigan No 2 Diesel Adj Sales/Deliveries for Off-Highway Construction (Thousand Gallons) | |||||
| Decade | Year-0 | Year-1 | Year-2 | Year-3 | Year-4 | Year-5 | Year-6 | Year-7 | Year-8 | Year-9 |
|---|---|---|---|---|---|---|---|---|---|---|
| 1980's | 21,644 | 31,124 | 31,113 | 39,343 | 48,182 | 43,959 | ||||
| 1990's | 36,629 | 56,584 | 37,403 | 55,208 | 63,458 | 38,255 | 43,109 | 55,511 | 49,449 | 62,768 |
| 2000's | 58,620 | 55,285 | 36,700 | 48,899 | 76,930 | 69,703 | 53,211 | 46,871 | 48,338 | 35,817 |
| 2010's | 37,605 | 31,608 | 32,110 | 35,324 | 34,175 | 38,264 | 38,832 | 31,860 | 40,995 | 44,429 |
| 2020's | 38,344 |
| - = No Data Reported; -- = Not Applicable; NA = Not Available; W = Withheld to avoid disclosure of individual company data. |
| Release Date: 2/9/2022 |
| Next Release Date: Suspended |