|
Download Data (XLS File) |
|
|||||
|
|||||
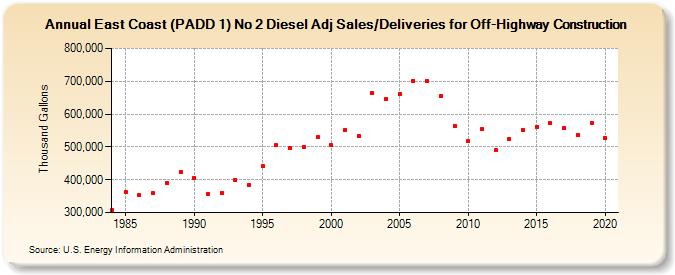
| East Coast (PADD 1) No 2 Diesel Adj Sales/Deliveries for Off-Highway Construction (Thousand Gallons) | |||||
| Decade | Year-0 | Year-1 | Year-2 | Year-3 | Year-4 | Year-5 | Year-6 | Year-7 | Year-8 | Year-9 |
|---|---|---|---|---|---|---|---|---|---|---|
| 1980's | 306,914 | 362,785 | 352,828 | 358,460 | 389,533 | 424,924 | ||||
| 1990's | 405,502 | 357,371 | 360,845 | 398,545 | 383,847 | 440,307 | 504,241 | 497,268 | 499,954 | 528,775 |
| 2000's | 504,318 | 551,408 | 532,680 | 664,095 | 646,739 | 661,347 | 700,639 | 701,321 | 654,478 | 563,280 |
| 2010's | 516,856 | 553,813 | 490,279 | 525,495 | 552,352 | 561,948 | 572,133 | 556,101 | 537,680 | 573,356 |
| 2020's | 527,926 |
| - = No Data Reported; -- = Not Applicable; NA = Not Available; W = Withheld to avoid disclosure of individual company data. |
| Release Date: 2/9/2022 |
| Next Release Date: Suspended |