|
Download Data (XLS File) |
|
|||||
|
|||||
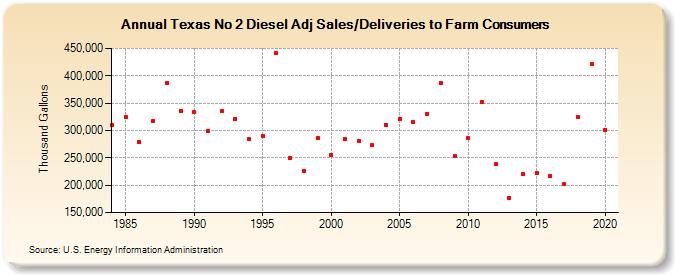
| Texas No 2 Diesel Adj Sales/Deliveries to Farm Consumers (Thousand Gallons) | |||||
| Decade | Year-0 | Year-1 | Year-2 | Year-3 | Year-4 | Year-5 | Year-6 | Year-7 | Year-8 | Year-9 |
|---|---|---|---|---|---|---|---|---|---|---|
| 1980's | 310,764 | 324,226 | 279,092 | 318,159 | 387,029 | 335,510 | ||||
| 1990's | 333,002 | 299,057 | 335,313 | 321,651 | 283,946 | 290,314 | 441,699 | 250,308 | 225,592 | 286,462 |
| 2000's | 255,997 | 285,040 | 281,210 | 272,937 | 310,533 | 321,553 | 314,885 | 330,441 | 387,633 | 253,990 |
| 2010's | 285,508 | 351,856 | 238,239 | 177,510 | 219,943 | 222,389 | 217,615 | 201,629 | 324,456 | 422,010 |
| 2020's | 301,105 |
| - = No Data Reported; -- = Not Applicable; NA = Not Available; W = Withheld to avoid disclosure of individual company data. |
| Release Date: 2/9/2022 |
| Next Release Date: Suspended |