|
Download Data (XLS File) |
|
|||||
|
|||||
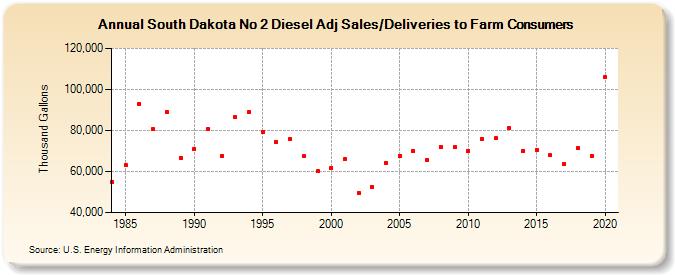
| South Dakota No 2 Diesel Adj Sales/Deliveries to Farm Consumers (Thousand Gallons) | |||||
| Decade | Year-0 | Year-1 | Year-2 | Year-3 | Year-4 | Year-5 | Year-6 | Year-7 | Year-8 | Year-9 |
|---|---|---|---|---|---|---|---|---|---|---|
| 1980's | 54,966 | 62,958 | 93,069 | 80,481 | 89,072 | 66,814 | ||||
| 1990's | 71,071 | 80,752 | 67,787 | 86,374 | 89,014 | 79,471 | 74,377 | 75,942 | 67,406 | 60,023 |
| 2000's | 61,846 | 65,935 | 49,622 | 52,580 | 64,366 | 67,758 | 70,097 | 65,815 | 72,092 | 71,887 |
| 2010's | 70,172 | 76,029 | 76,174 | 81,035 | 70,052 | 70,590 | 67,840 | 63,857 | 71,425 | 67,662 |
| 2020's | 105,917 |
| - = No Data Reported; -- = Not Applicable; NA = Not Available; W = Withheld to avoid disclosure of individual company data. |
| Release Date: 2/9/2022 |
| Next Release Date: Suspended |