|
Download Data (XLS File) |
|
|||||
|
|||||
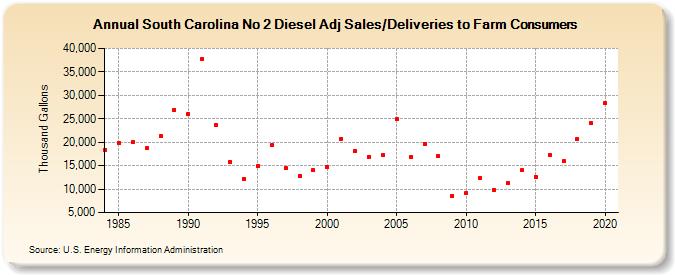
| South Carolina No 2 Diesel Adj Sales/Deliveries to Farm Consumers (Thousand Gallons) | |||||
| Decade | Year-0 | Year-1 | Year-2 | Year-3 | Year-4 | Year-5 | Year-6 | Year-7 | Year-8 | Year-9 |
|---|---|---|---|---|---|---|---|---|---|---|
| 1980's | 18,438 | 19,873 | 19,951 | 18,663 | 21,298 | 26,966 | ||||
| 1990's | 26,084 | 37,832 | 23,703 | 15,868 | 12,249 | 14,897 | 19,358 | 14,480 | 12,833 | 14,006 |
| 2000's | 14,630 | 20,755 | 18,156 | 16,919 | 17,339 | 24,870 | 16,865 | 19,704 | 17,049 | 8,635 |
| 2010's | 9,174 | 12,434 | 9,903 | 11,258 | 13,998 | 12,639 | 17,345 | 15,904 | 20,676 | 24,008 |
| 2020's | 28,258 |
| - = No Data Reported; -- = Not Applicable; NA = Not Available; W = Withheld to avoid disclosure of individual company data. |
| Release Date: 2/9/2022 |
| Next Release Date: Suspended |