|
Download Data (XLS File) |
|
|||||
|
|||||
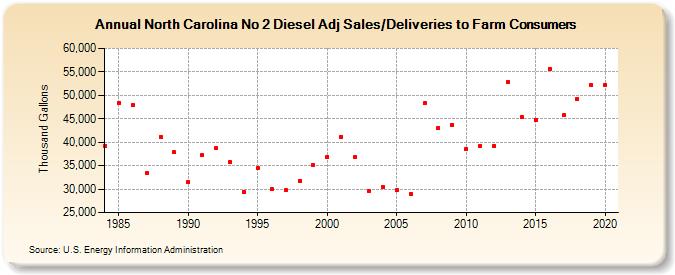
| North Carolina No 2 Diesel Adj Sales/Deliveries to Farm Consumers (Thousand Gallons) | |||||
| Decade | Year-0 | Year-1 | Year-2 | Year-3 | Year-4 | Year-5 | Year-6 | Year-7 | Year-8 | Year-9 |
|---|---|---|---|---|---|---|---|---|---|---|
| 1980's | 39,251 | 48,433 | 47,832 | 33,385 | 41,199 | 37,854 | ||||
| 1990's | 31,562 | 37,209 | 38,677 | 35,746 | 29,440 | 34,457 | 30,029 | 29,726 | 31,805 | 35,049 |
| 2000's | 36,850 | 41,195 | 36,797 | 29,652 | 30,523 | 29,776 | 28,969 | 48,288 | 43,048 | 43,766 |
| 2010's | 38,594 | 39,254 | 39,272 | 52,857 | 45,319 | 44,834 | 55,706 | 45,723 | 49,236 | 52,189 |
| 2020's | 52,269 |
| - = No Data Reported; -- = Not Applicable; NA = Not Available; W = Withheld to avoid disclosure of individual company data. |
| Release Date: 2/9/2022 |
| Next Release Date: Suspended |