|
Download Data (XLS File) |
|
|||||
|
|||||
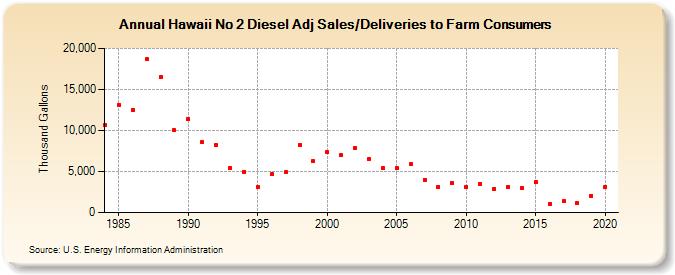
| Hawaii No 2 Diesel Adj Sales/Deliveries to Farm Consumers (Thousand Gallons) | |||||
| Decade | Year-0 | Year-1 | Year-2 | Year-3 | Year-4 | Year-5 | Year-6 | Year-7 | Year-8 | Year-9 |
|---|---|---|---|---|---|---|---|---|---|---|
| 1980's | 10,692 | 13,144 | 12,473 | 18,666 | 16,489 | 10,013 | ||||
| 1990's | 11,398 | 8,555 | 8,233 | 5,441 | 4,973 | 3,155 | 4,641 | 4,908 | 8,277 | 6,234 |
| 2000's | 7,369 | 6,994 | 7,844 | 6,548 | 5,417 | 5,426 | 5,868 | 3,998 | 3,173 | 3,609 |
| 2010's | 3,120 | 3,511 | 2,872 | 3,162 | 3,042 | 3,685 | 1,092 | 1,415 | 1,110 | 2,074 |
| 2020's | 3,107 |
| - = No Data Reported; -- = Not Applicable; NA = Not Available; W = Withheld to avoid disclosure of individual company data. |
| Release Date: 2/9/2022 |
| Next Release Date: Suspended |