|
Download Data (XLS File) |
|
|||||
|
|||||
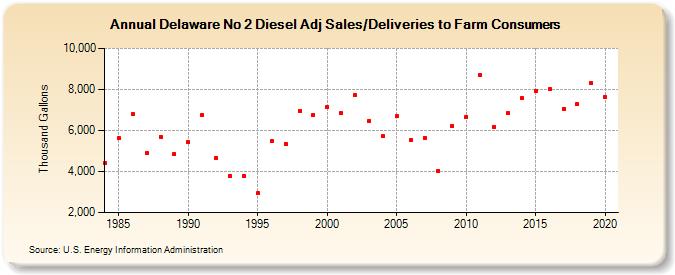
| Delaware No 2 Diesel Adj Sales/Deliveries to Farm Consumers (Thousand Gallons) | |||||
| Decade | Year-0 | Year-1 | Year-2 | Year-3 | Year-4 | Year-5 | Year-6 | Year-7 | Year-8 | Year-9 |
|---|---|---|---|---|---|---|---|---|---|---|
| 1980's | 4,394 | 5,625 | 6,781 | 4,899 | 5,700 | 4,854 | ||||
| 1990's | 5,438 | 6,756 | 4,675 | 3,796 | 3,794 | 2,930 | 5,466 | 5,356 | 6,966 | 6,775 |
| 2000's | 7,132 | 6,830 | 7,736 | 6,467 | 5,712 | 6,688 | 5,543 | 5,647 | 4,047 | 6,234 |
| 2010's | 6,672 | 8,693 | 6,187 | 6,848 | 7,593 | 7,936 | 7,999 | 7,067 | 7,269 | 8,302 |
| 2020's | 7,631 |
| - = No Data Reported; -- = Not Applicable; NA = Not Available; W = Withheld to avoid disclosure of individual company data. |
| Release Date: 2/9/2022 |
| Next Release Date: Suspended |