|
Download Data (XLS File) |
|
|||||
|
|||||
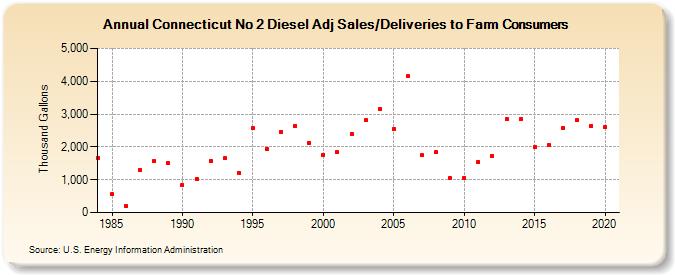
| Connecticut No 2 Diesel Adj Sales/Deliveries to Farm Consumers (Thousand Gallons) | |||||
| Decade | Year-0 | Year-1 | Year-2 | Year-3 | Year-4 | Year-5 | Year-6 | Year-7 | Year-8 | Year-9 |
|---|---|---|---|---|---|---|---|---|---|---|
| 1980's | 1,670 | 559 | 203 | 1,289 | 1,569 | 1,498 | ||||
| 1990's | 840 | 1,037 | 1,572 | 1,648 | 1,207 | 2,567 | 1,942 | 2,458 | 2,640 | 2,127 |
| 2000's | 1,765 | 1,834 | 2,399 | 2,813 | 3,160 | 2,546 | 4,149 | 1,738 | 1,836 | 1,042 |
| 2010's | 1,067 | 1,542 | 1,719 | 2,835 | 2,845 | 1,994 | 2,055 | 2,590 | 2,810 | 2,647 |
| 2020's | 2,592 |
| - = No Data Reported; -- = Not Applicable; NA = Not Available; W = Withheld to avoid disclosure of individual company data. |
| Release Date: 2/9/2022 |
| Next Release Date: Suspended |