|
Download Data (XLS File) |
|
|||||
|
|||||
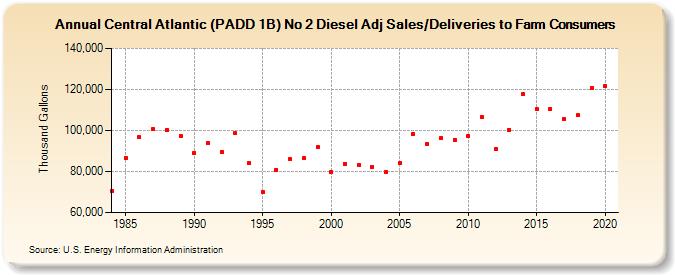
| Central Atlantic (PADD 1B) No 2 Diesel Adj Sales/Deliveries to Farm Consumers (Thousand Gallons) | |||||
| Decade | Year-0 | Year-1 | Year-2 | Year-3 | Year-4 | Year-5 | Year-6 | Year-7 | Year-8 | Year-9 |
|---|---|---|---|---|---|---|---|---|---|---|
| 1980's | 70,380 | 86,710 | 96,629 | 100,688 | 100,403 | 97,439 | ||||
| 1990's | 89,063 | 93,723 | 89,652 | 98,627 | 84,133 | 70,082 | 80,880 | 85,967 | 86,361 | 92,026 |
| 2000's | 79,713 | 83,850 | 83,126 | 82,350 | 79,832 | 83,917 | 98,329 | 93,612 | 96,270 | 95,567 |
| 2010's | 97,408 | 106,545 | 90,873 | 100,441 | 117,564 | 110,261 | 110,456 | 105,437 | 107,326 | 120,687 |
| 2020's | 121,844 |
| - = No Data Reported; -- = Not Applicable; NA = Not Available; W = Withheld to avoid disclosure of individual company data. |
| Release Date: 2/9/2022 |
| Next Release Date: Suspended |