|
Download Data (XLS File) |
|
||||||||
|
||||||||
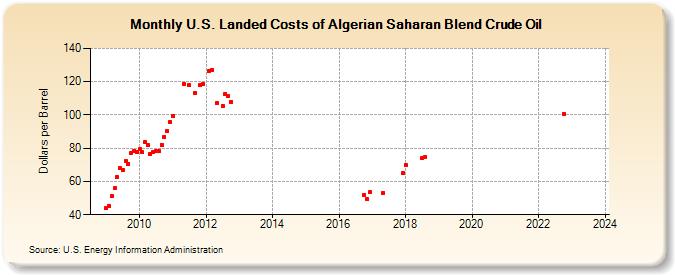
| U.S. Landed Costs of Algerian Saharan Blend Crude Oil (Dollars per Barrel) | ||||||||
| Year | Jan | Feb | Mar | Apr | May | Jun | Jul | Aug | Sep | Oct | Nov | Dec |
|---|---|---|---|---|---|---|---|---|---|---|---|---|
| 2009 | 44.17 | 45.45 | 51.22 | 55.82 | 62.53 | 67.82 | 66.86 | 72.37 | 70.74 | 77.40 | 78.33 | 77.68 |
| 2010 | 79.21 | 77.54 | 83.49 | 81.78 | 76.36 | 77.43 | 78.56 | 78.25 | 82.12 | 86.77 | 90.09 | 95.75 |
| 2011 | 99.12 | W | W | W | 118.66 | W | 117.91 | W | 113.22 | W | 117.87 | 118.77 |
| 2012 | W | 126.21 | 126.97 | W | 107.20 | W | 105.62 | 112.77 | 111.32 | 108.03 | W | W |
| 2013 | W | W | W | W | W | W | W | W | ||||
| 2015 | W | |||||||||||
| 2016 | W | W | W | W | W | W | 52.01 | 49.15 | 53.37 | |||
| 2017 | W | W | W | 53.31 | W | W | W | W | W | 64.88 | ||
| 2018 | 70.13 | W | W | W | W | W | 73.97 | 74.53 | W | W | W | W |
| 2019 | W | W | W | W | W | |||||||
| 2020 | W | W | W | |||||||||
| 2021 | W | W | W | W | W | W | ||||||
| 2022 | W | W | 100.57 | |||||||||
| 2023 | W | W | ||||||||||
| - = No Data Reported; -- = Not Applicable; NA = Not Available; W = Withheld to avoid disclosure of individual company data. |
| Release Date: 4/1/2024 |
| Next Release Date: 5/1/2024 |