|
Download Data (XLS File) |
|
||||||||
|
||||||||
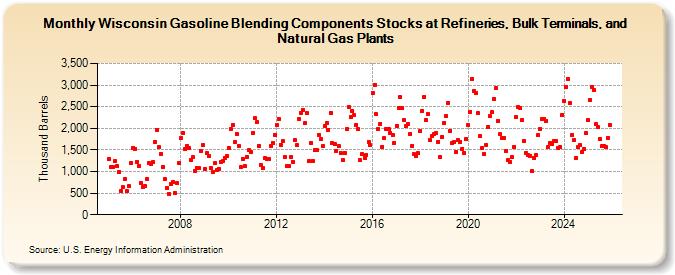
| Wisconsin Gasoline Blending Components Stocks at Refineries, Bulk Terminals, and Natural Gas Plants (Thousand Barrels) | ||||||||
| Year | Jan | Feb | Mar | Apr | May | Jun | Jul | Aug | Sep | Oct | Nov | Dec |
|---|---|---|---|---|---|---|---|---|---|---|---|---|
| 2005 | 1,289 | 1,105 | 1,101 | 1,233 | 1,120 | 994 | 553 | 633 | 832 | 538 | 657 | 1,197 |
| 2006 | 1,547 | 1,530 | 1,231 | 1,135 | 742 | 648 | 663 | 836 | 1,191 | 1,170 | 1,211 | 1,683 |
| 2007 | 1,971 | 1,556 | 1,415 | 1,114 | 822 | 629 | 487 | 722 | 766 | 509 | 728 | 1,199 |
| 2008 | 1,765 | 1,899 | 1,524 | 1,587 | 1,547 | 1,276 | 1,325 | 1,021 | 1,084 | 1,084 | 1,484 | 1,610 |
| 2009 | 1,059 | 1,423 | 1,368 | 1,089 | 991 | 1,190 | 1,030 | 1,068 | 1,225 | 1,243 | 1,319 | 1,355 |
| 2010 | 1,548 | 1,979 | 2,071 | 1,677 | 1,874 | 1,591 | 1,101 | 1,296 | 1,116 | 1,342 | 1,490 | 1,452 |
| 2011 | 1,894 | 2,228 | 2,138 | 1,595 | 1,158 | 1,079 | 1,304 | 1,281 | 1,294 | 1,601 | 1,667 | 1,851 |
| 2012 | 2,070 | 2,224 | 1,621 | 1,701 | 1,333 | 1,127 | 1,123 | 1,326 | 1,223 | 1,720 | 1,612 | 2,217 |
| 2013 | 2,354 | 2,425 | 2,115 | 2,347 | 1,235 | 1,662 | 1,249 | 1,488 | 1,505 | 1,852 | 1,750 | 1,584 |
| 2014 | 2,053 | 2,119 | 1,969 | 2,359 | 1,661 | 1,629 | 1,484 | 1,587 | 1,436 | 1,268 | 1,431 | 1,977 |
| 2015 | 2,488 | 2,257 | 2,395 | 2,298 | 2,085 | 1,973 | 1,262 | 1,398 | 1,324 | 1,382 | 1,687 | 1,610 |
| 2016 | 2,812 | 3,002 | 2,322 | 1,978 | 2,108 | 1,575 | 1,775 | 1,989 | 1,980 | 1,892 | 1,848 | 1,671 |
| 2017 | 2,060 | 2,470 | 2,714 | 2,460 | 2,187 | 2,055 | 2,089 | 1,877 | 1,596 | 1,397 | 1,355 | 1,428 |
| 2018 | 1,934 | 2,411 | 2,732 | 2,195 | 2,321 | 1,720 | 1,824 | 1,869 | 1,891 | 1,686 | 1,332 | 1,808 |
| 2019 | 2,134 | 2,275 | 2,594 | 1,945 | 1,658 | 1,686 | 1,460 | 1,719 | 1,687 | 1,531 | 1,434 | 1,749 |
| 2020 | 2,066 | 2,384 | 3,141 | 2,859 | 2,807 | 2,343 | 1,827 | 1,537 | 1,405 | 1,617 | 2,032 | 2,282 |
| 2021 | 2,366 | 2,678 | 2,921 | 2,176 | 1,859 | 1,776 | 1,783 | 1,480 | 1,262 | 1,227 | 1,327 | 1,571 |
| 2022 | 2,264 | 2,490 | 2,469 | 2,201 | 1,708 | 1,438 | 1,375 | 1,369 | 1,016 | 1,318 | 1,371 | 1,838 |
| 2023 | 1,993 | 2,217 | 2,225 | 2,170 | 1,570 | 1,656 | 1,616 | 1,717 | 1,693 | 1,550 | 1,572 | 2,303 |
| 2024 | 2,620 | |||||||||||
| - = No Data Reported; -- = Not Applicable; NA = Not Available; W = Withheld to avoid disclosure of individual company data. |
| Release Date: 3/29/2024 |
| Next Release Date: 4/30/2024 |