|
Download Data (XLS File) |
|
||||||||
|
||||||||
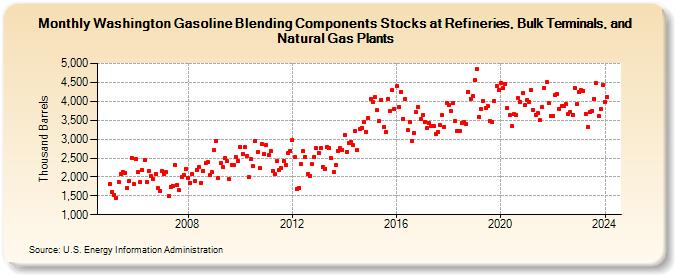
| Washington Gasoline Blending Components Stocks at Refineries, Bulk Terminals, and Natural Gas Plants (Thousand Barrels) | ||||||||
| Year | Jan | Feb | Mar | Apr | May | Jun | Jul | Aug | Sep | Oct | Nov | Dec |
|---|---|---|---|---|---|---|---|---|---|---|---|---|
| 2005 | 1,812 | 1,591 | 1,510 | 1,451 | 1,870 | 2,077 | 2,131 | 2,110 | 1,707 | 1,893 | 2,504 | 1,815 |
| 2006 | 2,462 | 2,132 | 1,864 | 2,183 | 2,442 | 1,874 | 2,156 | 2,020 | 1,950 | 2,074 | 1,697 | 1,624 |
| 2007 | 2,157 | 2,064 | 2,119 | 1,484 | 1,743 | 1,772 | 2,308 | 1,789 | 1,649 | 1,988 | 2,041 | 2,215 |
| 2008 | 1,964 | 1,840 | 2,066 | 1,891 | 2,194 | 2,264 | 1,844 | 2,168 | 2,356 | 2,383 | 2,042 | 2,124 |
| 2009 | 2,708 | 2,952 | 1,974 | 2,371 | 2,254 | 2,494 | 2,415 | 1,936 | 2,319 | 2,304 | 2,530 | 2,422 |
| 2010 | 2,799 | 2,608 | 2,788 | 2,548 | 1,989 | 2,462 | 2,278 | 2,953 | 2,647 | 2,232 | 2,868 | 2,604 |
| 2011 | 2,843 | 2,574 | 2,672 | 2,156 | 2,070 | 2,422 | 2,175 | 2,239 | 2,422 | 2,324 | 2,622 | 2,697 |
| 2012 | 2,981 | 2,517 | 1,667 | 1,719 | 2,339 | 2,674 | 2,537 | 2,072 | 2,035 | 2,329 | 2,533 | 2,761 |
| 2013 | 2,641 | 2,752 | 2,271 | 2,217 | 2,785 | 2,761 | 2,491 | 2,136 | 2,308 | 2,697 | 2,758 | 2,723 |
| 2014 | 3,120 | 2,670 | 2,899 | 2,929 | 2,835 | 3,210 | 2,717 | 3,261 | 3,298 | 3,441 | 3,196 | 3,557 |
| 2015 | 4,060 | 3,992 | 4,105 | 3,760 | 3,471 | 4,037 | 3,326 | 3,194 | 4,069 | 3,739 | 4,295 | 3,805 |
| 2016 | 4,394 | 3,847 | 4,254 | 3,542 | 4,064 | 3,234 | 3,465 | 2,956 | 3,165 | 3,707 | 3,853 | 3,535 |
| 2017 | 3,635 | 3,462 | 3,281 | 3,422 | 3,339 | 3,358 | 3,137 | 3,190 | 3,365 | 3,632 | 3,327 | 3,966 |
| 2018 | 3,890 | 3,740 | 3,951 | 3,490 | 3,224 | 3,207 | 3,434 | 3,449 | 3,399 | 4,256 | 4,068 | 4,138 |
| 2019 | 4,550 | 4,843 | 3,588 | 3,796 | 4,018 | 3,832 | 3,874 | 3,478 | 3,443 | 4,000 | 4,409 | 4,289 |
| 2020 | 4,488 | 4,340 | 4,468 | 3,823 | 3,637 | 3,345 | 3,657 | 3,628 | 4,077 | 3,987 | 4,212 | 3,892 |
| 2021 | 4,031 | 3,983 | 4,306 | 3,764 | 3,645 | 3,678 | 3,493 | 3,842 | 4,351 | 4,503 | 3,953 | 3,598 |
| 2022 | 3,611 | 4,159 | 4,195 | 3,795 | 3,866 | 3,874 | 3,916 | 3,652 | 3,715 | 3,632 | 4,353 | 3,916 |
| 2023 | 4,239 | 4,293 | 4,271 | 3,673 | 3,314 | 3,712 | 3,739 | 4,068 | 4,483 | 3,599 | 3,792 | 4,428 |
| 2024 | 3,992 | |||||||||||
| - = No Data Reported; -- = Not Applicable; NA = Not Available; W = Withheld to avoid disclosure of individual company data. |
| Release Date: 3/29/2024 |
| Next Release Date: 4/30/2024 |